Best Methods for Interpreting Complex Cardiovascular Trial Subgroup Analyses
A clinician-grade framework — pre-specification, the interaction test, biological plausibility, and consistency — for separating real subgroup signals from statistical noise in cardiovascular trials.
- ▸A single subgroup p-value tells you almost nothing. The only valid statistical test of a subgroup difference is the test for interaction.
- ▸With 10 subgroups tested at α = 0.05, the probability of at least one false-positive finding is roughly 40%. Multiplicity, not malice, drives most spurious claims.
- ▸Pre-specification with a declared biological rationale separates a hypothesis test from a fishing expedition. Post-hoc subgroups are exploratory by construction.
- ▸Quantitative interactions (same direction, different magnitudes) are biologically common and often credible. Qualitative interactions (effect reverses) are rare and demand replication.
- ▸A credible subgroup claim satisfies five criteria simultaneously: pre-specification, significant interaction, biological plausibility, external consistency, and internal consistency across endpoints.
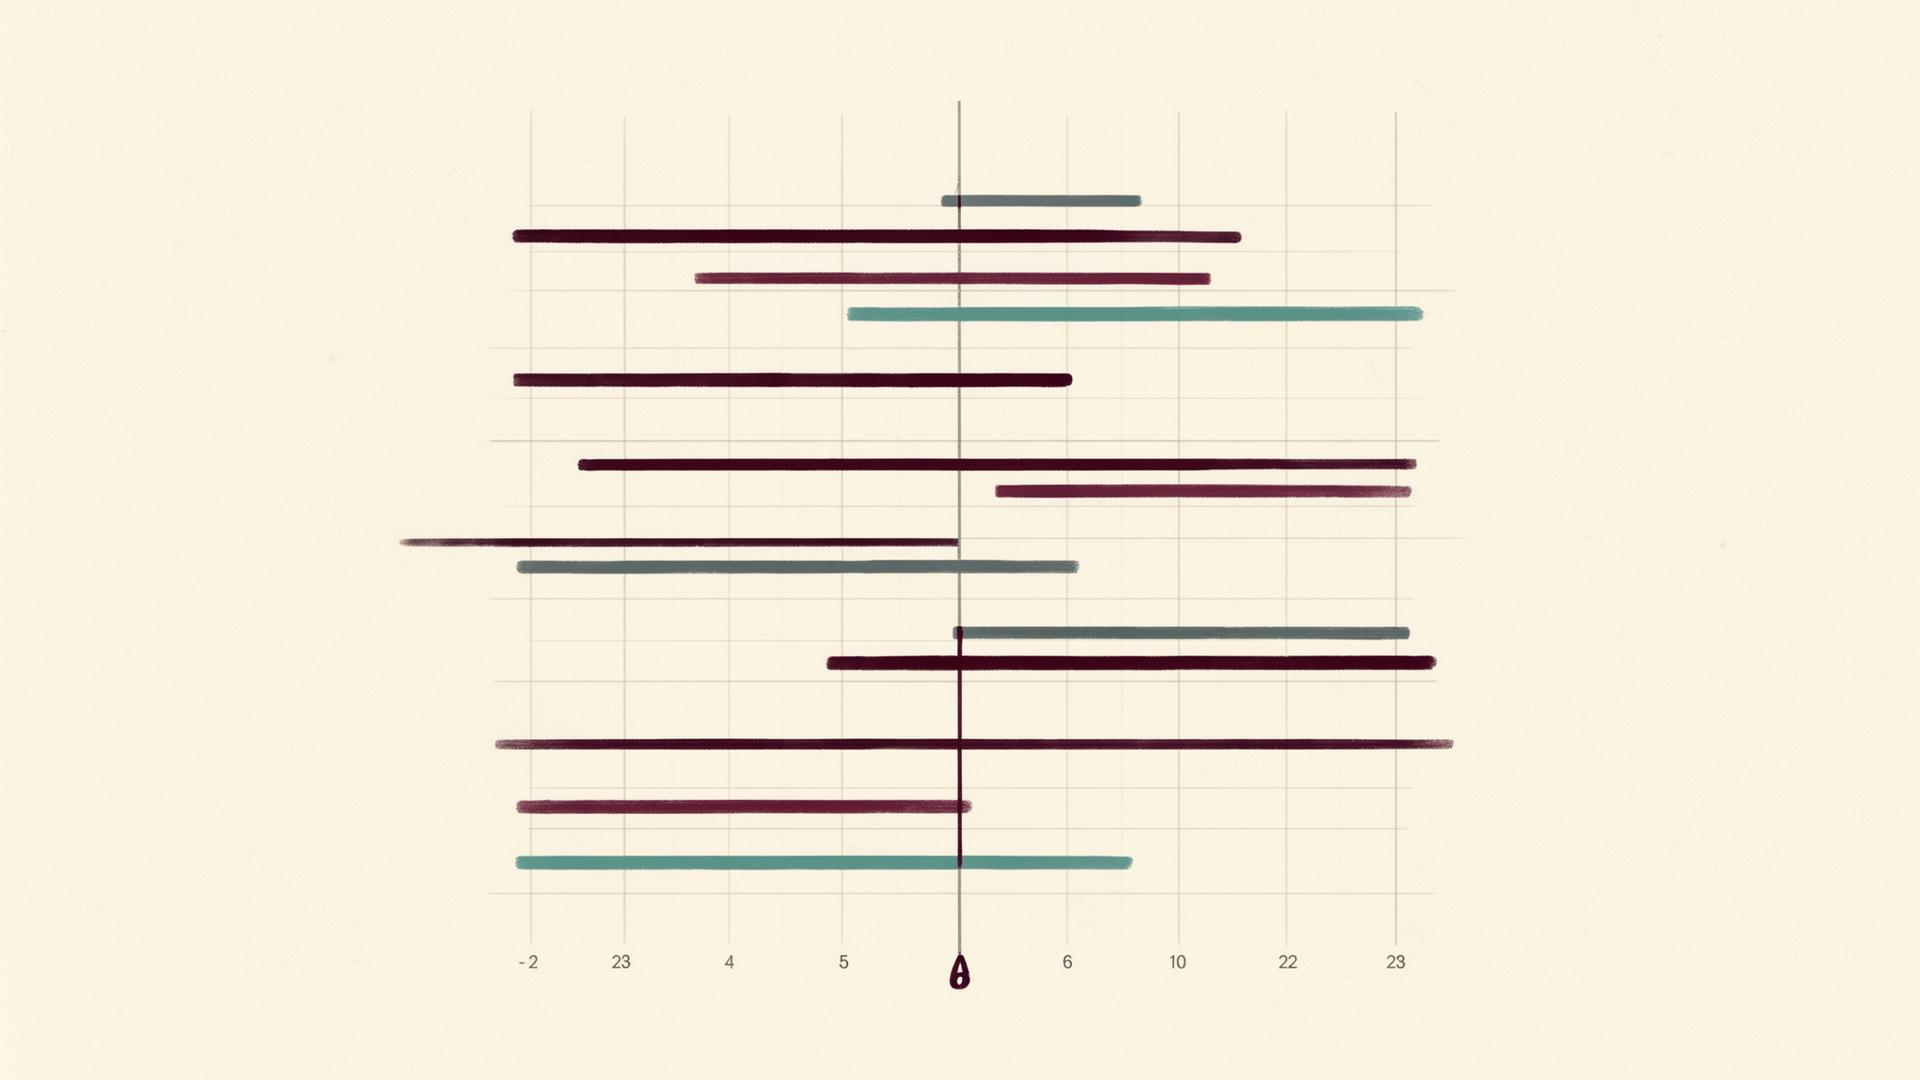
Every major cardiovascular outcomes trial carries within it a quiet temptation. The headline result tells us whether a drug, device, or strategy worked across the population studied. But buried in the appendix sits the forest plot: a long ladder of horizontal lines comparing the treatment effect in men versus women, the young versus the old, diabetics versus non-diabetics, the East Asians versus the Europeans. It is here, in the subgroups, that promising therapies are sometimes resurrected from a neutral trial — a pattern visible across many of the breakthrough cardiovascular trials reading out in 2026 — and where, more often than the literature admits, clinicians are seduced into prescribing decisions built on statistical noise.
The discipline of reading these analyses well is one of the most important skills in evidence-based cardiology, and one of the least taught. The aim of this article is to set out, in clear terms, the framework that thoughtful trialists and journal editors actually apply when deciding whether a subgroup finding deserves to change practice. We will look at the statistical machinery, the cognitive traps, and the practical criteria for separating signal from noise.
The Statistical Problem of Multiplicity
Before we discuss interpretation, we have to understand why so many subgroup findings are wrong. The reason is not that researchers are dishonest. It is that probability is unforgiving when you ask it too many questions at once.
A single hypothesis test conducted at the conventional significance level of α = 0.05 carries a five per cent chance of producing a false positive when the underlying truth is null. Run the test once and that risk is acceptable. Run it fourteen times against the same dataset, however, and the probability that at least one of those tests will return a spurious "significant" result climbs to roughly 51 per cent. This is the multiplicity problem, and it is the single most important fact to internalise when reading subgroup analyses.
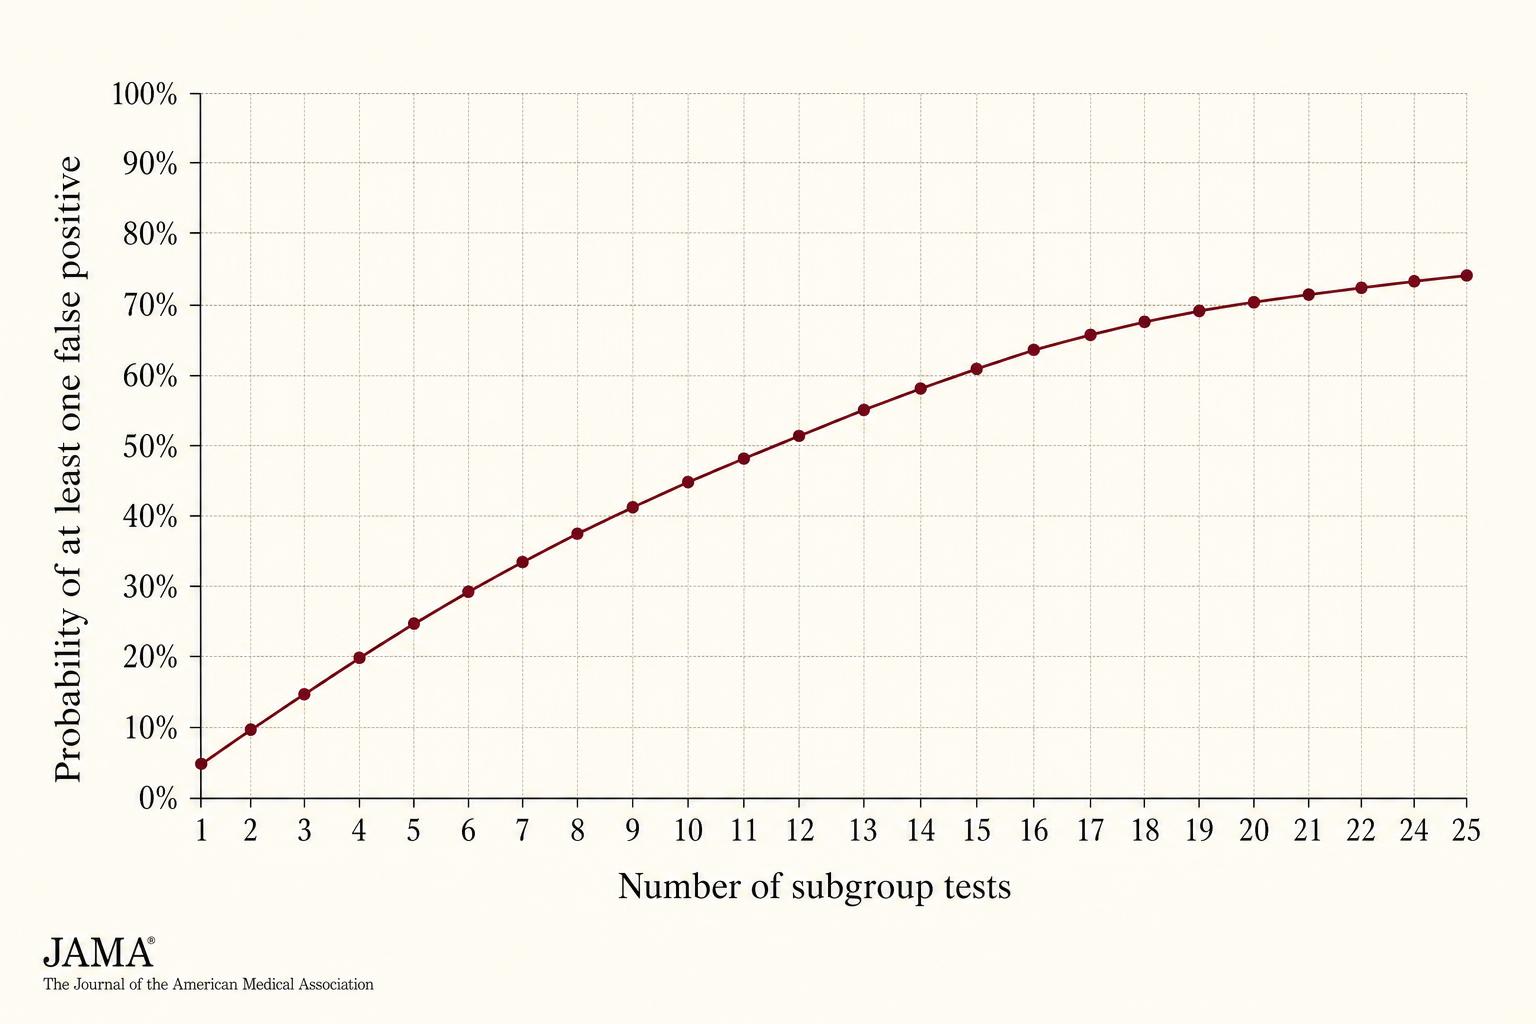
Figure 1. The probability of finding at least one spurious "significant" subgroup grows steeply with the number of subgroups tested. A typical cardiovascular trial appendix presents twelve to twenty subgroups — virtually guaranteeing that at least one will appear meaningful by chance alone.
This is why the act of finding a "significant" subgroup, on its own, tells you almost nothing. The relevant question is never did this subgroup show a different result? It is always is the difference between subgroups larger than chance would predict?

Pre-Specification: The First Line of Defence
The single most important question to ask about any subgroup analysis is whether it was planned before the trial began. Pre-specification — declared in the protocol or statistical analysis plan, with a hypothesis tied to a biological rationale — transforms the analysis from fishing expedition into hypothesis test. Post-hoc analyses, conducted after the headline result is known, are exploratory by construction. They generate hypotheses; they do not confirm them.
This distinction is not academic. When investigators conduct a planned subgroup test with a specific direction of effect anticipated in advance, they are betting against the null hypothesis with a coherent story. When they go looking after the fact for any subgroup that happens to be statistically interesting, they are sampling from noise. The mathematics may look identical on the page, but the inferential weight is not remotely the same.
Table 1 — Pre-specified vs. post-hoc subgroup analyses
| Feature | Pre-specified | Post-hoc |
|---|---|---|
| Hypothesis | Declared before data unblinded; biologically grounded | Generated after seeing results |
| Number of tests | Limited and disclosed in protocol | Typically unconstrained |
| Multiplicity correction | Often built into the analysis plan | Rarely applied |
| Inferential strength | Confirmatory if interaction test is significant | Hypothesis-generating only |
| Should it change practice? | Possibly, if the totality of evidence supports it | No — requires confirmation in a new trial |
Reputable trial reports will state explicitly which analyses were pre-specified. If the publication is vague on this point, treat every subgroup claim as exploratory until proven otherwise.
The Interaction Test, Properly Understood
Here is the most common error in reading a forest plot. A reader notices that the confidence interval for "women" crosses the line of no effect, while the confidence interval for "men" does not. The reader concludes that the treatment works in men but not in women. This conclusion is almost always wrong.
Comparing the within-subgroup p-values is the wrong analysis. The right analysis is the test for interaction, which asks whether the magnitude of treatment effect differs between subgroups by more than chance would predict. A non-significant interaction test means that any apparent difference between subgroups is statistically compatible with the same true treatment effect operating in both. The fact that one subgroup happens to be smaller, and therefore underpowered to show statistical significance on its own, does not constitute evidence that the drug fails to work in that group.
When an interaction is genuine, it takes one of two forms, and the distinction matters considerably.
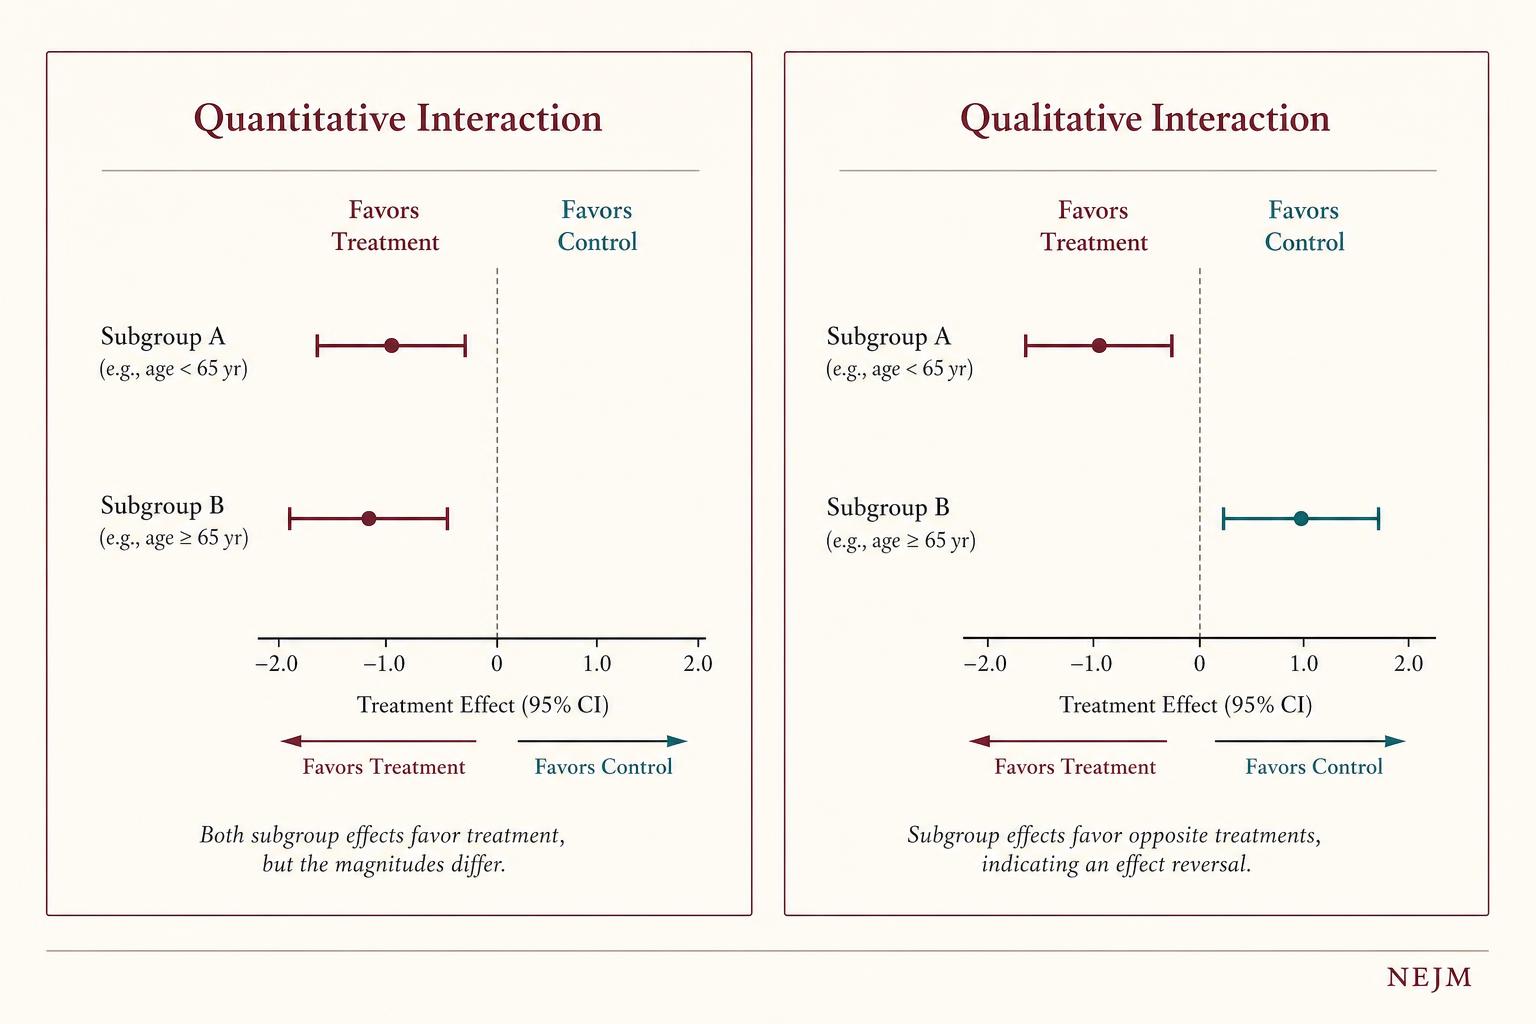
Figure 2. A quantitative interaction means both subgroups respond in the same direction but with different magnitudes — this is biologically common and often credible. A qualitative interaction means the treatment reverses direction across subgroups — biologically rare, and almost always demanding replication before it should change practice.
Qualitative interactions, where a treatment helps one subgroup and harms another, are biologically uncommon. When a forest plot appears to show one, the prior probability that it represents chance rather than truth is substantially higher than for quantitative interactions in the same direction. Subgroup claims based on apparent qualitative effects therefore warrant the strictest scrutiny.
Five Criteria for a Credible Subgroup Finding
Methodological writers, including the CONSORT statement working groups and the editors of major cardiovascular journals, have converged on a small set of criteria that distinguish credible subgroup signals from statistical artefacts. No single criterion is sufficient. The strength of a subgroup claim is roughly proportional to how many of these are satisfied simultaneously.
The first is pre-specification with a biological rationale. The trialists declared the hypothesis in advance, and the rationale rests on plausible pharmacology, pathophysiology, or prior trial data — not on inspection of the present dataset.
The second is a statistically significant interaction test, ideally one that survives any correction for multiple comparisons declared in the analysis plan.
The third is biological plausibility of the proposed mechanism: there must be a coherent reason why the treatment should behave differently in this subgroup, articulable independently of the result that prompted the question.
The fourth is consistency with external evidence — prior trials, meta-analyses, mechanistic studies — pointing in the same direction.
The fifth is internal consistency: the subgroup effect should appear, in proportional form, across related endpoints in the same trial. A drug that supposedly reduces cardiovascular death in women but has no effect on non-fatal infarction or stroke in women is a drug whose subgroup story is unlikely to be real.
Table 2 — Credibility checklist for a subgroup claim
| Criterion | What to look for | Why it matters |
|---|---|---|
| Pre-specification | Declared in protocol or analysis plan, with hypothesised direction of effect | Distinguishes hypothesis test from fishing expedition |
| Significant interaction | P-interaction below threshold set by the analysis plan, not just within-subgroup p-values | The only valid statistical test of subgroup difference |
| Biological plausibility | A mechanism articulable without reference to the present dataset | Reduces probability that the finding is post-hoc rationalisation |
| External consistency | Aligns with prior trials, meta-analyses, mechanistic literature | Independent replication is the strongest evidence in medicine |
| Internal consistency | Effect appears proportionally across related endpoints in the trial | A real biological effect rarely picks one endpoint and ignores the others |
Reading a Forest Plot Without Being Misled
The forest plot is the standard visual summary of subgroup analyses, and it is engineered to seduce. A horizontal line that fails to cross the vertical reference line at unity looks compelling. A line that does cross it looks like an absence of benefit. Trained readers know to ignore both impressions and focus instead on the column of interaction p-values usually printed in the right margin of the figure.
Figure 3. The visual grammar of a forest plot rewards disciplined reading. The vertical reference line at HR = 1.0 invites a binary verdict — "crosses or doesn''t" — that carries no inferential weight when comparing subgroups.
The vertical line at hazard ratio 1.0 invites a binary reading: either the confidence interval crosses it, or it does not. This dichotomy carries no inferential weight when comparing subgroups. Two subgroups can show identical underlying treatment effects yet present, on the page, with one confidence interval crossing the line and the other not — purely because one subgroup contains more patients than the other. Within-subgroup significance is a function of subgroup size as much as treatment effect.
The disciplined approach is to scan the point estimates and ask whether they cluster around a similar value. If the hazard ratios across subgroups are visually clustered between, say, 0.75 and 0.85, the trial is telling a consistent story about the treatment effect, regardless of how many of those individual confidence intervals happen to cross unity. If the point estimates fan out widely, with some near 0.6 and others near 1.2, then meaningful heterogeneity may be present — and that is when the interaction p-value becomes the deciding piece of evidence.
A Practical Framework for Evaluation
The following workflow distils the principles above into a sequence any clinician can apply when faced with a subgroup analysis in a cardiovascular publication.
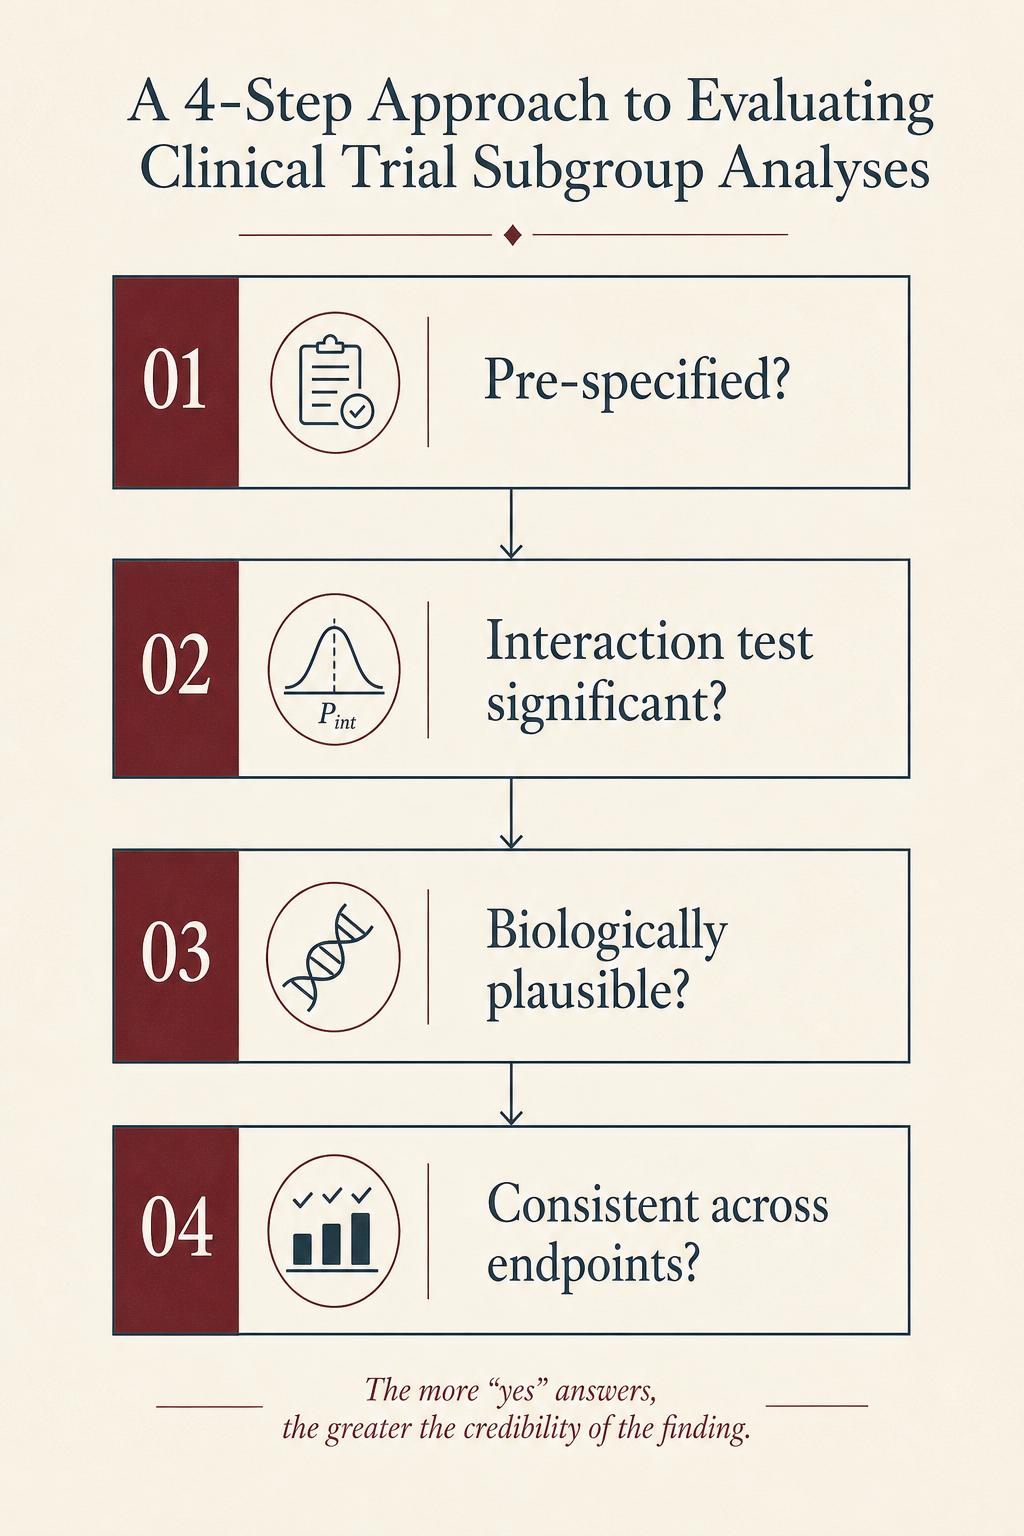
Figure 4. A subgroup finding that fails any of these four tests should be regarded, at best, as hypothesis-generating. Only when all four are satisfied does a subgroup result rise to the level of evidence on which clinical decisions can responsibly be built.
Famous Cautionary Tales
The history of cardiovascular medicine offers more spectacular examples of subgroup misadventure than any other branch of medicine. The most cited is the ISIS-2 trial of aspirin in acute myocardial infarction. The trialists, making a sardonic point about subgroup analysis, included astrological birth signs as a subgroup variable. Aspirin appeared statistically ineffective in patients born under Gemini or Libra, while being clearly beneficial in every other sign. No clinician took this seriously, which was the authors'' intent: they had demonstrated, with great economy, that any sufficiently sliced dataset will produce nonsense if you ask it to.
Less amusing examples include the early subgroup suggestions that beta-blockers were harmful in Black patients with heart failure, later overturned by adequately powered confirmatory trials, and repeated cycles of suggestion and refutation about sex differences in statin efficacy, antiplatelet response, and renin-angiotensin system blockade — including disputed signals around homocysteine-lowering therapy that we cover in Homocysteine and Heart Disease. In each case the initial subgroup claim arrived with the hallmarks of post-hoc analysis: weak biological rationale, no pre-specification, modest interaction p-value, and absent external replication. In each case the clinical recommendations built on those claims had to be revised once larger and better-designed trials produced the contrary answer.
Conclusion
Subgroup analyses are, when handled with discipline, among the most useful instruments in clinical research. They refine our understanding of who benefits and who may not. They generate the hypotheses that next-generation trials are built to test. The error is not in performing them; it is in granting them more inferential weight than the underlying statistics can support.
A subgroup finding from a single trial — even a striking one — almost never deserves to change practice on its own. It deserves, instead, to be examined against the framework set out above: pre-specification, the interaction test, biological plausibility, external consistency, internal consistency. When a finding clears all of those bars, it begins to look like signal. Until then, the safest assumption is that what you are seeing is the texture of noise, dressed in the visual grammar of certainty.
For the working clinician, the practical implication is straightforward. Read the headline result of a cardiovascular trial as the trial''s actual finding. Read the forest plot as a hypothesis-generating appendix. And before letting any subgroup result alter how you prescribe, ask whether an independent trial has replicated it. In cardiology more than almost anywhere else in medicine, the cost of getting this judgement wrong is measured in lives.
References
- ISIS-2: Randomised trial of intravenous streptokinase, oral aspirin, both, or neither among 17,187 cases of suspected acute myocardial infarction
- Wang R, Lagakos SW, Ware JH, Hunter DJ, Drazen JM. Statistics in Medicine — Reporting of Subgroup Analyses in Clinical Trials
- Sun X, Ioannidis JPA, Agoritsas T, Alba AC, Guyatt G. How to use a subgroup analysis: Users' guide to the medical literature
- Pocock SJ, Assmann SE, Enos LE, Kasten LE. Subgroup analysis, covariate adjustment and baseline comparisons in clinical trial reporting
- CONSORT 2010 Statement: updated guidelines for reporting parallel group randomised trials
Get the Heart Health Weekly
Research summaries and practical tips on blood pressure, cardiovascular health, and weight loss. No spam.